What and Who is cmfproperty for?
The property tax is the single largest source of locally generated revenue for American local governments. Cities, counties, school districts, and special districts raise roughly $500 billion per year in property taxes according to The Urban Institute.
Property taxes are supposed to be a flat tax where everyone pays the same rate regardless of how much their home is worth. In practice, property taxes are regressive in almost every single county in America, according to a recent nationwide analysis by the Center for Municipal Finance which analyzed 40 million property sales. For an individual homeowner, understanding if their home was assessed fairly is relatively difficult. A homeowner only knows what their home is assessed for and only knows how accurately their home was assessed if it sells in a given year.
cmfproperty provides the necessary tools for the public, assessors, and public interest groups to evaluate the effectiveness of assessment systems by removing subject-matter and technical barriers and producing automated contextualized reports. These reports analyze the assessor’s own data using industry standards and visualizations designed to illustrate inequities and package the information in an easy to use format.
How do I use cmfproperty?
First, check out the article on preprocessing which outlines data requirements and examples. In order to analyze assessments, data is required to have at least three columns: Sale Year, Sale Price, and Assessed Value.
head(cmfproperty::example_data)
#>              PIN SALE_YEAR SALE_PRICE ASSESSED_VALUE
#> 1 17273100931118      2015      53000          33860
#> 2 18013090421010      2018      80000          60390
#> 3 12111190201042      2018     118000         108300
#> 4 13093160601015      2017     125500          87200
#> 5 14322110150000      2018    3705000        3670740
#> 6 27021200080000      2016     345000         267280
After gathering data in this form, we have to identify the three required columns (sales, assessments, and sale year) for the package using cmfproperty::reformat_data.
ratios <-
  cmfproperty::reformat_data(
    data = cmfproperty::example_data,
    sale_col = "SALE_PRICE",
    assessment_col = "ASSESSED_VALUE",
    sale_year_col = "SALE_YEAR",
  )
#> [1] "Filtered out non-arm's length transactions"
#> [1] "Inflation adjusted to 2019"
head(as.data.frame(ratios))
#>              PIN SALE_YEAR SALE_PRICE ASSESSED_VALUE TAX_YEAR     RATIO
#> 1 17273100931118      2015      53000          33860     2015 0.6388679
#> 2 18013090421010      2018      80000          60390     2018 0.7548750
#> 3 12111190201042      2018     118000         108300     2018 0.9177966
#> 4 13093160601015      2017     125500          87200     2017 0.6948207
#> 5 14322110150000      2018    3705000        3670740     2018 0.9907530
#> 6 27021200080000      2016     345000         267280     2016 0.7747246
#>   arms_length_transaction SALE_PRICE_ADJ ASSESSED_VALUE_ADJ
#> 1                       1       59209.48           37827.04
#> 2                       1       82313.03           62136.05
#> 3                       1      121411.71          111431.26
#> 4                       1      132854.54           92310.09
#> 5                       1     3812122.01         3776871.45
#> 6                       1      376080.37          291358.73
We denote data processed by cmfproperty::reformat_data as ratios throughout the documentation. ratios includes the additional calculated fields needed to complete the study.
There’s one more step to get the automated report:
cmfproperty::make_report(ratios,
                         jurisdiction_name = "Cook County, Illinois")
The report will be saved in your working directory or a specific directory can be provided.
cmfproperty::make_report(ratios,
                         jurisdiction_name = "Cook County, Illinois",
                         output_dir = "~/Desktop/")
Check out an example report here.
How does this work?
Check out our methods and information on figures in addition to function-level documentation. The core unit of analysis that we use (and is standard) is the Sales Ratio. A sales ratio is a calculated ratio between the sale price and assessed value at the time of sale for an individual property. Properties should be assessed at their fair market value which is defined as the sale price when sold between two unrelated parties in an arm’s length transaction. We then apply the standard method to determine if a sale is arm’s length from the International Association of Assessing Officers.
If you would like to use our package to make your own report, simply take ratios and create stats.
stats <- cmfproperty::calc_iaao_stats(ratios)
head(stats)
#>       N     COD COD_SE    PRD PRD_SE     PRB PRB_SE  q1_ratio median_ratio
#> 1 51879 19.2009 6.1946 1.0578 0.0079 -0.0514 0.0012 0.7758364    0.9093448
#> 2 62852 20.0905 6.6369 1.0798 0.0219 -0.0462 0.0011 0.7705720    0.9001375
#> 3 65961 20.0706 5.8239 1.0600 0.0074 -0.0269 0.0011 0.7428108    0.8732099
#> 4 65298 18.4733 5.1744 1.0308 0.0077  0.0133 0.0010 0.7470336    0.8856039
#> 5 62041 18.0105 5.5011 1.0143 0.0097  0.0098 0.0010 0.7681042    0.9035000
#>   q3_ratio q1_sale median_sale q3_sale q1_assessed_value median_assessed_value
#> 1 1.057180  148000      230000  375000          136670.0                213430
#> 2 1.060422  148000      229900  365000          133940.0                209150
#> 3 1.031267  155000      235000  365000          136960.0                209380
#> 4 1.021504  159642      239900  370000          132382.5                210645
#> 5 1.036399  164900      245000  372000          140220.0                217690
#>   q3_assessed_value Year
#> 1          331235.0 2015
#> 2          321720.0 2016
#> 3          316300.0 2017
#> 4          331257.5 2018
#> 5          336480.0 2019
With stats and ratios, you have the necessary tools for all the forms of analysis we present. For example,
output <- diagnostic_plots(stats,
                           ratios,
                           min_reporting_yr = 2015,
                           max_reporting_yr = 2019)

output[[1]]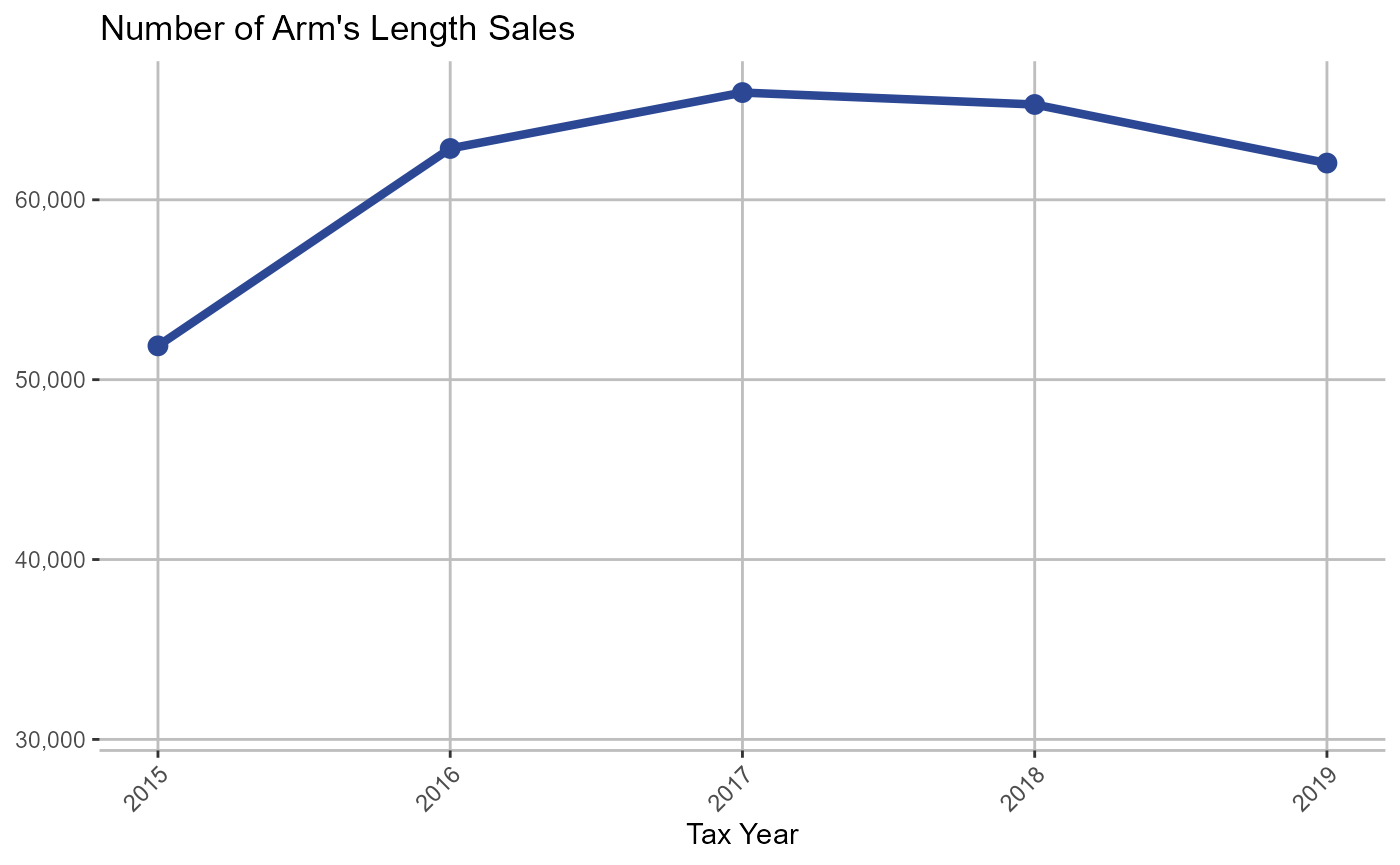
Report Diagnostic
We also present a series of diagnostic graphs to evaluate data quality, especially unexpected year-to-year changes. The diagnostic section can optionally be included as an appendix to the report as follows.
cmfproperty::make_report(ratios,
                         jurisdiction_name = "Cook County, Illinois Diagnostic",
                         output_dir = "~/../Documents/GitHub/cmf-uchicago.github.io/",
                         diagnostic = TRUE)
Check out a report on the example data with a diagnostic section here.